The module has various functionalities, such as basic alignment and mesh edition tools, perfect geometry creation for comparison, mesh-to-CAD and mesh-to-mesh comparison, and advanced automatic report generation. With those functionalities, challenging applications, such as pipeline radius bending, ovality assessment, corrosion rate metric, dimensional control and validation, and elbow corrosion can solved.
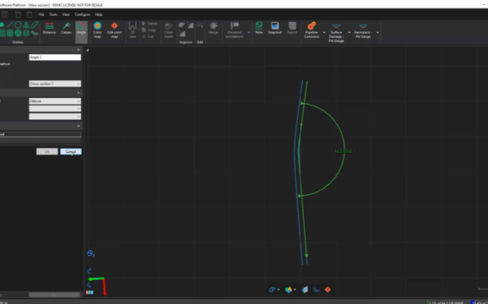
Pigs are very expensive instruments that may sometimes get caught in a deformed pipeline. When this situation occurs, the only way to get back the Pig is to cut the pipeline inside the pipe.
With the Monitoring Module, it is possible to validate the dimensions of the infrastructure before the pig inspection, avoiding unnecessary downtimes and costly operations in case of an accident.
Analysis tools
-Automatic Report generation
-Inner Radius
-Outside Radius
-Cross-section views
-Caliper measurement tools
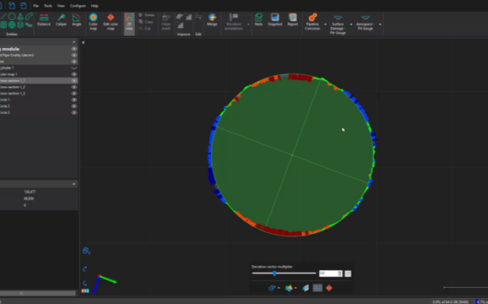
There are multiple maintenance repair procedures that require a good tolerance between different components.
With the Monitoring Module, it is now easier to validate the dimensions of an infrastructure with the highest level of precision before reparation or component changes.
Analysis tools
-Ovality deviation on cross sections
-3D Cross-section views
-Caliper measurement tools
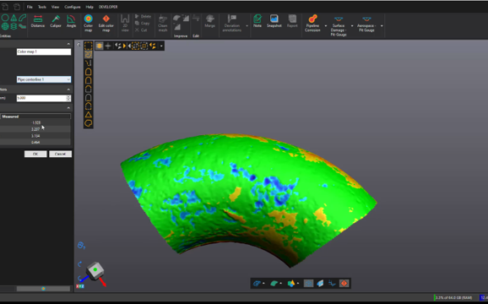
Assessment of external corrosion on multi-radius shapes has always been challenging. Indeed, it is difficult to lay properly a pit gauge on the surface of such a component without affecting the measure result.
With the Monitoring Module, generating a color map on elbow components to measure general corrosion is now possible and has never been easier.
Analysis tools
-Pipe center line Feature
-Weld de- selection
-Color map
-Color map Palette Edition
-Grid Deviation
-Snapshot/Note
-Automatic PDF reporting
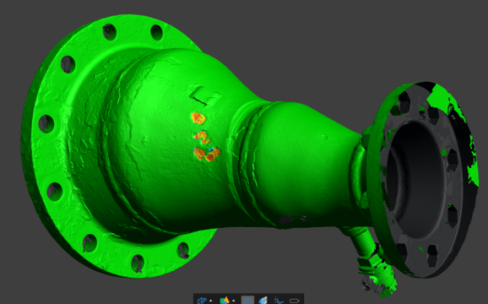
Corrosion rate is a very useful metric to evaluate the remaining life of a component, prioritize repairs and plan the maintenance of equipment.
Our technology is accurate up to 25 microns, and the data generated is basically noiseless. 3D scan data is perfect for comparing the evolution of damage through time and noticing even the slightest evolution
Analysis tools
-Mesh to Mesh comparison
-Mesh to CAD comparison
-Color map
-Color map Palette Edition
-Grid Deviation
-Snapshot/Note
-Automatic PDF reporting
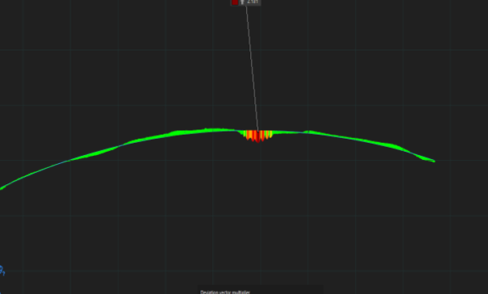
The visualization of a damage profile is very valuable for the asset owner, namely for the reporting traceability of the technique.
Our technology easily generates 2D view cross-sections of the component and damage to document the defect geometries represent it in an advanced report
Analysis tools
-Cross-section views
-Manual tools
-Annotations
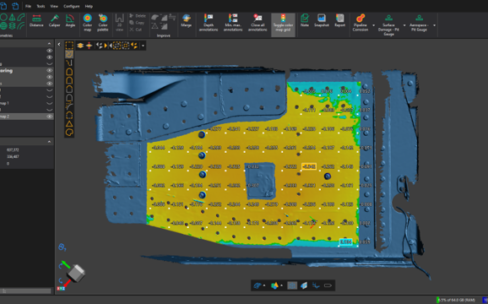
Measuring a damage in narrow, complex, or inaccessible places is challenging in most industries. Our technology does not require direct contact with the part to be inspected. The precision of our technology is not affected by the bad field conditions during the acquisition.
Moreover, the thickness losses can be extracted in many ways, granting our solution all the flexibility required for challenging inspection requirements.
Analysis tools
-Mesh to Mesh comparison
-Mesh to CAD comparison
-Mesh to perfect geometries
-Color map / Palette
-Snapshot/Note
-Automatic PDF reporting